
Hierarchical Clustering and its Applications
Clustering is one of the most well known techniques in Data Science. From customer segmentation to outlier detection, it has a broad range of uses, and different techniques that fit different use cases. In this blog post we will take a look at hierarchical clustering, which is the hierarchical application of clustering techniques.
Clustering
Clustering, in one sentence, is the extraction of natural groupings of similar data objects.
There are a couple of general ideas that occur quite frequently with respect to clustering:
- The clusters should be naturally occurring in data.
- The clustering should discover hidden patterns in the data.
- Data points within the cluster should be similar.
- Data points in two different clusters should not be similar.
Common algorithms used for clustering include K-Means, DBSCAN, and Gaussian Mixture Models.
Hierarchical Clustering
As mentioned before, hierarchical clustering relies using these clustering techniques to find a hierarchy of clusters, where this hierarchy resembles a tree structure, called a dendrogram.
Hierarchical clustering is the hierarchical decomposition of the data based on group similarities
Finding hierarchical clusters
There are two top-level methods for finding these hierarchical clusters:
- Agglomerative clustering uses a bottom-up approach, wherein each data point starts in its own cluster. These clusters are then joined greedily, by taking the two most similar clusters together and merging them.
- Divisive clustering uses a top-down approach, wherein all data points start in the same cluster. You can then use a parametric clustering algorithm like K-Means to divide the cluster into two clusters. For each cluster, you further divide it down to two clusters until you hit the desired number of clusters.
Both of these approaches rely on constructing a similarity matrix between all of the data points, which is usually calculated by cosine or Jaccard distance.
Applications of Hierarchical Clustering
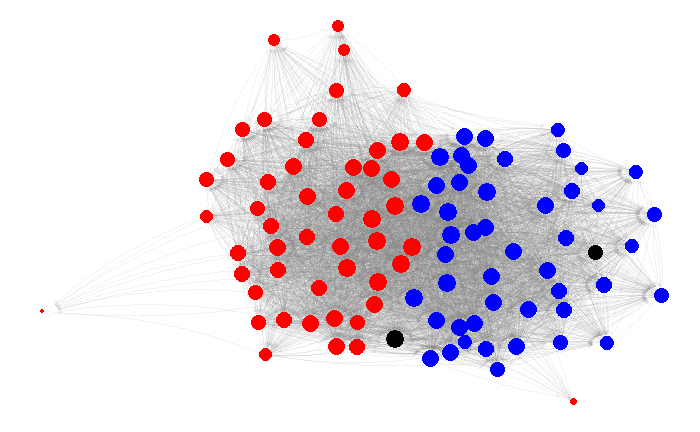
1) US Senator Clustering through Twitter
Can we find the party lines through Twitter?
Following the controversial “Twitter mood predicts the stock market” paper, researchers have been looking at Twitter as a source of highly valuable data. In this example, we use Twitter to cluster US senators into their respective parties.
Our data is simple: we only look at which senators follow which senators. That defines a graph structure with senators as the nodes and follows as the edges.
On this graph, we use the Walktrap algorithm by Pons et al., which does a random walk through graph, and estimates the senator similarity by the number of times you end up at certain senator starting from a senator.
After getting these similarities, we can use agglomerative clustering to find the dendrogram.
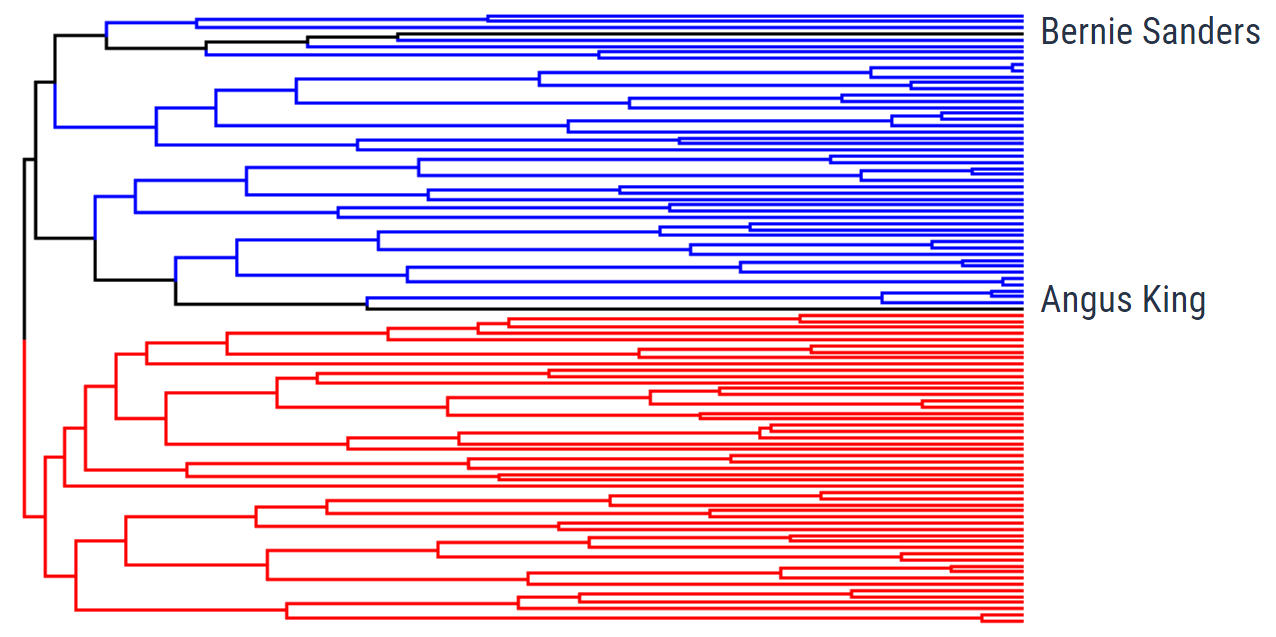
In order to measure how well our clustering worked, we can color the results with the party colors. As you can see, Democrats and Republicans are very clearly split from the top, showing the success of this method.
You also might’ve noticed the two black lines, denoting the independent senators. These are a little trickier to evaluate, but both Sen. Bernie Sanders and Sen. Angus King caucus with the Democratic Party, meaning that it is natural that they are in the Democratic Party branch of the tree.
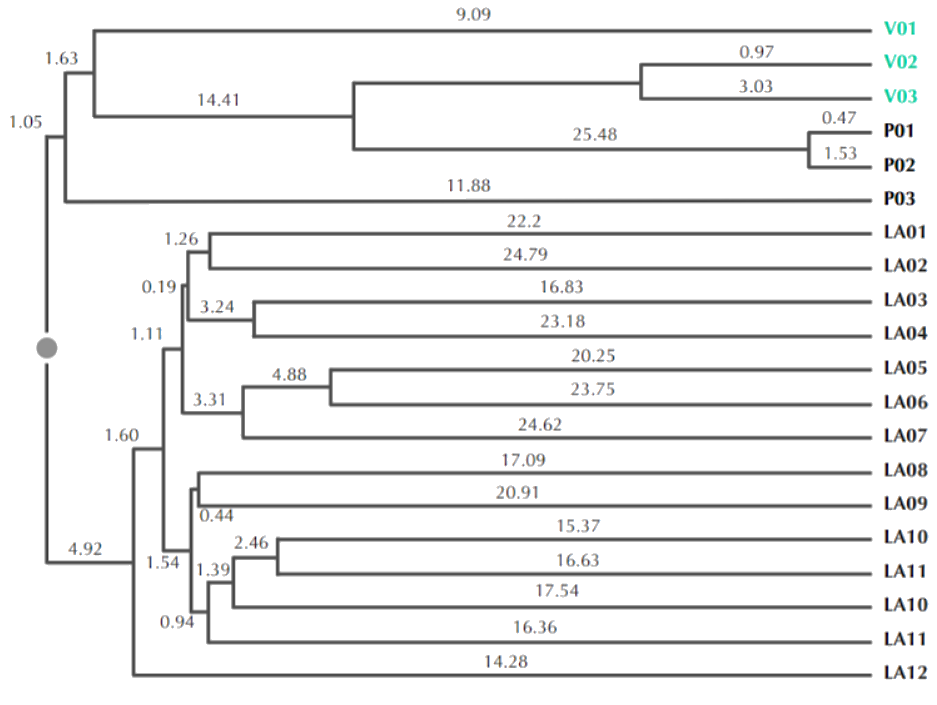
2) Charting Evolution through Phylogenetic Trees
How can we relate different species together?
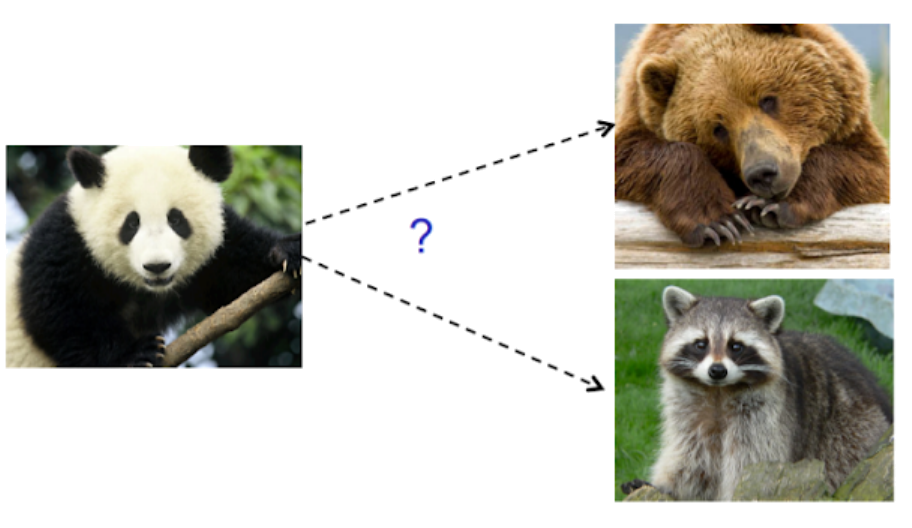
In the decades before DNA sequencing was reliable, the scientists struggled to answer a seemingly simple question: Are giant pandas closer to bears or racoons?
Nowadays, we can use DNA sequencing and hierarchical clustering to find the phylogenetic tree of animal evolution:
- Generate the DNA sequences.
- Calculate the edit distance between all sequences.
- Calculate the DNA similarities based on the edit distances.
- Construct the phylogenetic tree.
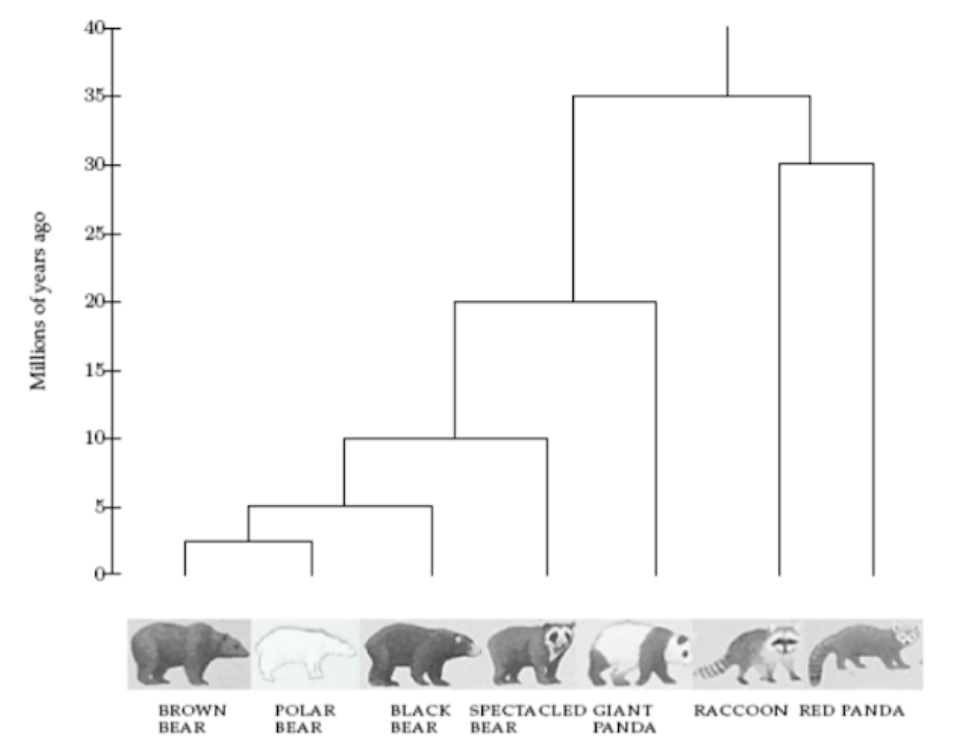
As a result of this experiment, the researchers were able to place the giant pandas closer to bears.
3) Tracking Viruses through Phylogenetic Trees
Can we find where a viral outbreak originated?
Tracking viral outbreaks and their sources is a major health challenge. Tracing these outbreaks to their source can give scientists additional data as to why and how the outbreak began, potentially saving lives.
Viruses such as HIV have high mutation rates, which means the similarity of the DNA sequence of the same virus depends on the time since it was transmitted. This can be used to trace paths of transmission.
This method was used as evidence in a court case, wherein the victim’s strand of HIV was found to be more similar to the accused patient’s strand, compared to a control group.
A similar study was also done for finding the animal that gave the humans the SARS virus:
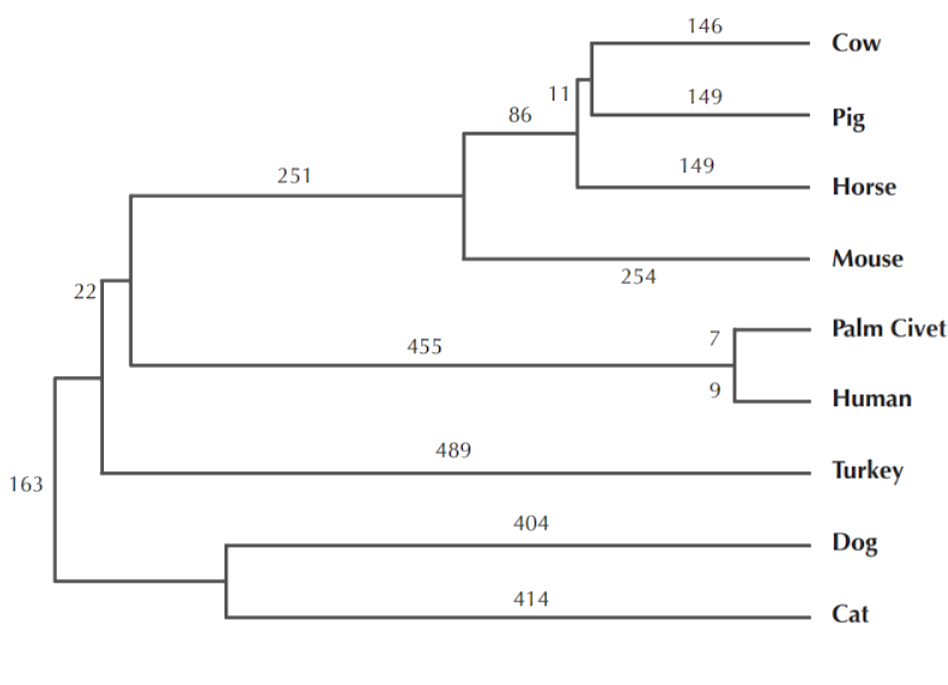
So humans got the SARS virus from palm civets… right?
“With the data at hand, we see how the virus used different hosts, moving from bat to human to civet, in that order. So the civets actually got SARS from humans.” - ScienceDaily

Conclusion
Hierarchical clustering is a powerful technique that allows you to build tree structures from data similarities. You can now see how different sub-clusters relate to each other, and how far apart data points are. Just keep in mind that these similarities do not imply causality, as with the palm civet example, and you will have another tool at your disposal.
References
- Big Data Science (NYU) lecture slides by Dr. Anasse Bari
- Bioinformatics (Bogazici University) lecture notes by Dr. Arzucan Ozgur